
What do you understand by indifference curves? How are they derived? Describe their properties.

In microeconomic theory, an indifference curve is a graph showing different bundles of goods between which a consumer is indifferent. That is, at each point on the curve, the consumer has no preference for one bundle over another. One can equivalently refer to each point on the indifference curve as rendering the same level of utility (satisfaction) for the consumer. Utility is then a device to represent preferences rather than something from which preferences come. The main use of indifference curves is in the representation of potentially observable demand patterns for individual consumers over commodity bundles.

There are infinitely many indifference curves: one passes through each combination. A collection of (selected) indifference curves, illustrated graphically, is referred to as an indifference map.

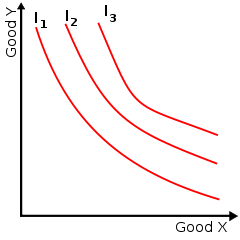
An example of an indifference map with three indifference curves represented

Properties of indifference curve:
  • Slopes downward to the right
  • Upward sloping
  • Straight line parallel to X-axis
  • Indifference curve cannot be parallel to the Y-axis
  • Indifference curve is convex to the origin
  • Downward sloping straight line
  • Indifference curve cannot be concave to the origin
  • Indifference curve cannot intersect each other
  • Higher indifference curve represent higher level of satisfaction than lower IC
  • Indifference curve need not be parallel

Comments

Popular posts from this blog

Case Study: A perfect competition

In 1997, over $700 billion purchases were charged on credit cards, and this total is increasing at a rate of over 10 per cent a year. At first glance, the credit card market would seem to be a rather concentrated industry. Visa, MasterCard and American Express are the most familiar names, and over 60 per cent of all charges are made using one of these three cards. But on closer examination, the industry seems to exhibit most characteristics of perfect competition. Consider first the size and distribution of buyers and sellers. Although Visa, Mastercard and American Express are the choices of the majority of consumers, these cards do not originate from just three firms. In fact, there are over six thousand enterprises (primarily banks and credit unions) in the US that offer charge cards to over 90 million credit card holders. One person's Visa card may have been issued by his company's credit union in Los Angeles, while a next door neighbour may have acquired hers from a Miami B...

Case Study: Bhopal Gas Tragedy - Communication Failures #1

On 3 December 1984, a runaway reaction had occurred in a storage tank of methylisocyanate (MIC), which was used to manufacture a pesticide. The valves of the tank had burst, and a cloud of poisonous gas had escaped. The winds carried it to nearby shanty towns and the populous city of Bhopal, where thousands of people either died in their sleep or woke and died while fleeing. Those who survived suffered from burning eyes and lungs. Local medical facilities were not equipped for the disaster, and over the next few weeks thousands more died. Due to production problems, the plant was under a great deal of pressure to cut costs. A number of shortcuts had thus been taken with such items as crew training, staffing patterns and maintenance schedules. The original procedure called for upto two years of training for employees in critical superintendent capacities, but the plant operators had received about a month long training, using classroom materials developed in the US and printed in Eng...

Discuss isoquant curves and isoquant maps.

In economics, an isoquant (derived from quantity and the Greek word iso, meaning equal) is a contour line drawn through the set of points at which the same quantity of output is produced while changing the quantities of two or more inputs. While an indifference curve mapping helps to solve the utility-maximizing problem of consumers, the isoquant mapping deals with the cost-minimization problem of producers. Isoquants are typically drawn on capital-labor graphs, showing the technological tradeoff between capital and labor in the production function, and the decreasing marginal returns of both inputs. Adding one input while holding the other constant eventually leads to decreasing marginal output, and this is reflected in the shape of the isoquant. A family of isoquants can be represented by an isoquant map , a graph combining a number of isoquants, each representing a different quantity of output. Isoquants are also called equal product curves. Production Isoquant/Isocost Curve ...